Trading confirmation insights/ trading confirmation signals
In the dynamic world of trading, confirmation indicators are essential tools that help traders validate their trading signals and make more informed decisions. Trading confirmation insights are essential for ensuring that your trades are aligned with market momentum, helping to improve your accuracy and reduce the risk of false signals. Confirmation indicators help traders validate trading setups, giving them confidence in their decisions and improving the effectiveness of their strategies.This article delves into the top 5 confirmation indicators that traders are currently using to gain an edge in the market. From the versatile Composite Index to the innovative Chartmill Value, each indicator offers unique insights into market trends and potential trading opportunities.
Key Takeaways
- The Composite Index is renowned for its ability to confirm market trends by combining price and momentum data in a unique way, providing accurate trading confirmation signals.
- The Elegant Oscillator stands out for its ability to identify subtle shifts in market momentum, which can be crucial for trend confirmation, offering valuable trading confirmation insights.
- Dorsey Inertia is gaining popularity as a confirmation indicator due to its focus on the inertia of price movements, providing a different perspective on market strength.
1. Composite Index
In the chart below, the crossover of the Composite Index coincides with a bullish trend, confirming a strong upward momentum.
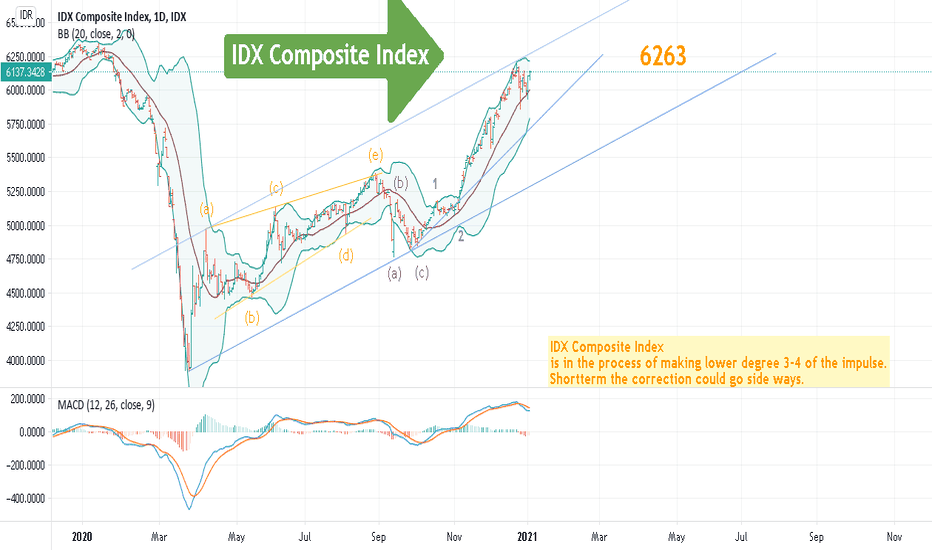
The Composite Index stands out as a sophisticated tool that combines various elements to provide a clearer picture of market trends. This indicator is particularly useful for identifying the momentum behind price movements. By analyzing the relationship between two lines that cross, traders can discern potential bull or bear trends, offering traders trading confirmation insights into whether a trend is gaining strength or weakening. It’s a blend of several indicators, which makes it a versatile choice for many trading strategies. To effectively use the Composite Index, follow these steps:
- Monitor the two lines for a crossover.
- Confirm the trend direction with additional indicators.
- Apply this insight to your trading decisions for better market timing.
Remember, the Composite Index is not just about the crossover; it’s about the subtleties in market movements that it can reveal, making it a valuable addition to your trading arsenal.
By incorporating trading confirmation signals, such as those provided by the Composite Index, traders can better validate their signals and avoid entering false trades. When combined with other tools like momentum indicators, it delivers trading confirmation insights that can refine entry and exit points, boosting the chances of successful trades.
2. Elegant Oscillator
The Chart below demonstrates how the Elegant Oscillator signals overbought conditions, aligning with a price reversal.
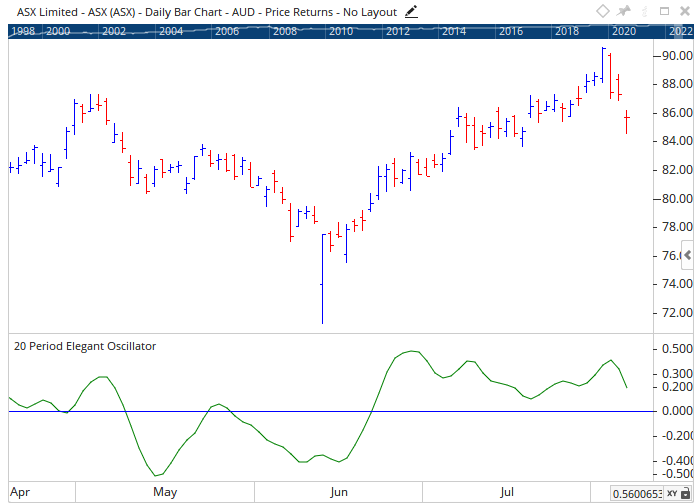
The Elegant Oscillator is a sophisticated tool that you might feel you’ve encountered before. Its familiarity comes from the fact that it incorporates elements from well-known indicators within the MT4 platform, creating a sense of deja vu for many traders. This responsive, almost lag-free indicator is suitable for trending markets, offering accurate signals that enhance the success rate of trade setups. It operates in a separate window, with a range between 0 and 100, marking 75 as overbought and 25 as oversold. It offers immediate trading confirmation insights into whether a market is overbought or oversold. The Elegant Oscillator is particularly effective when combined with candlestick patterns, providing additional confirmation for buy and sell positions.
Why the Elegant Oscillator is Effective for Confirmation Signals:
- Suitable for various trading styles, including scalping, day/intraday, and swing trading.
- Helps traders pinpoint precise price reversals.
- Accommodates both novice and experienced traders.
By mastering advanced technical analysis with tools like the Elegant Oscillator, you can identify trends, anticipate price movements, and make informed trading decisions.
3. Dorsey Inertia
In the chart below, Dorsey Inertia remains strong, confirming the likelihood of an uptrend continuation.
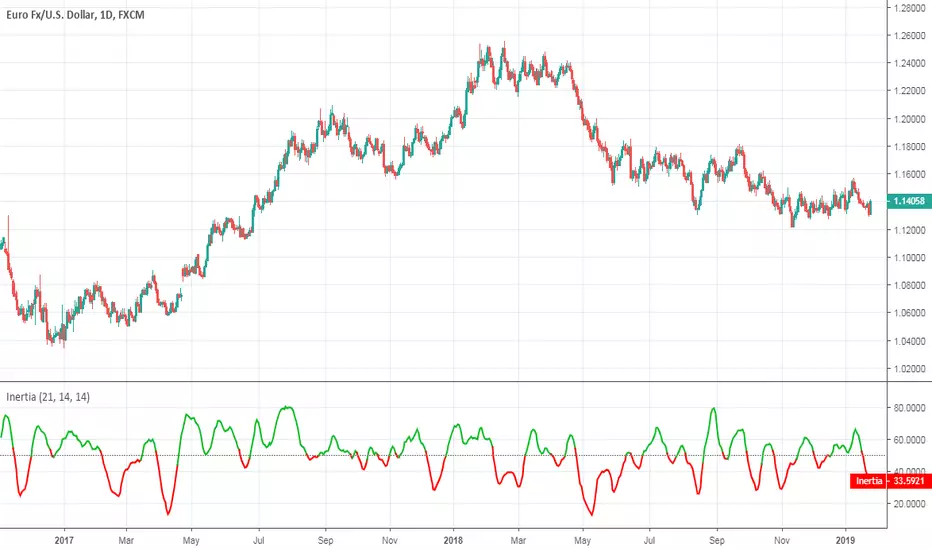
When you delve into the world of trading, you’ll quickly realize the importance of following the trend. This is where Dorsey Inertia comes into play. It’s a confirmation indicator that relies on the principle that trends have inertia—meaning they are more likely to continue than to reverse. Dorsey Inertia can help you gauge the strength of a trend and determine whether it’s likely to persist. The concept was developed on the premise that inertia is a function of trend, and it takes more energy to change a trend than to let it continue. Here’s how you can use Dorsey Inertia in your trading strategy:
- Identify the prevailing trend direction using price action or other trend indicators.
- Apply the Dorsey Inertia to confirm the strength of the trend.
- Look for divergence between price and the Dorsey Inertia as a potential signal for trend reversal.
Remember, while Dorsey Inertia is a powerful tool, it’s most effective when used in conjunction with other indicators and analysis techniques. Always ensure you have multiple data points confirming your trade before you commit.
Using trading confirmation signals like Dorsey Inertia can provide essential confirmation insights about market strength, allowing traders to confirm the likelihood that a trend will continue. When combined with other indicators that analyze market momentum, such as the Elegant Oscillator or momentum candles, the resulting trading confirmation signals help traders decide whether to stay in or exit a trade with more confidence.
4. Momentum Candles
The chart below shows a bullish momentum candle confirming a strong upward breakout.
Momentum candles are a powerful tool for traders looking to confirm trends and potential reversals. These candles are not just ordinary price bars; they encapsulate the velocity of price movements within a given timeframe. When a momentum candle appears, it signifies a strong buying or selling pressure, which can be a critical signal for your trading decisions. To effectively use momentum candles, you should look for significant changes in size and color compared to the surrounding candles. A large bullish momentum candle, for example, can indicate a robust upward trend, especially when it follows a period of consolidation or precedes a breakout from a recognized pattern. Conversely, a large bearish candle may signal an impending downtrend. Incorporating momentum candles into your strategy can enhance your analysis, particularly when combined with other confirmation indicators. For instance, aligning momentum candles with moving averages crossovers or chart patterns like flags and triangles can provide a more comprehensive view of the market’s direction. Remember, no single indicator should be used in isolation, but rather as part of a broader, well-considered strategy.

5. Chartmill Value
The chart below highlights a stock breaking out, confirmed by Chartmill Value analysis.
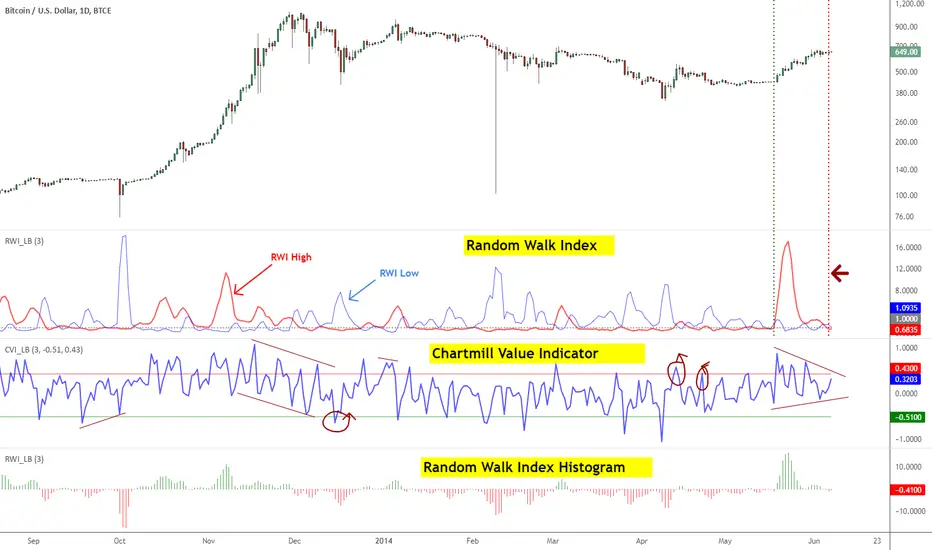
As you delve into the world of trading, the Chartmill Value indicator emerges as a crucial tool for identifying market trends and setups. This indicator is particularly adept at pinpointing technical breakout swing trading setups, offering a streamlined approach to filter stocks poised for significant moves. To effectively utilize the Chartmill Value indicator, consider the following steps:
- Begin by selecting your desired market or stock universe.
- Apply the Chartmill Value filter to identify stocks with breakout potential.
- Analyze the results and look for confirmation with other technical indicators or chart patterns.
Remember, while the Chartmill Value can be a powerful asset, it’s essential to integrate it into a comprehensive trading strategy. By doing so, you can enhance your decision-making process and potentially increase your trading success. Unlock the secrets of the stock market with Sniper Trades’ ‘Chartmill Value’ and elevate your trading game. Our community of seasoned traders provides daily insights into technical analysis, chart patterns, and options flow data to help you make informed decisions. Don’t miss out on the opportunity to join the fastest-growing Discord group for traders.
Chartmill Value provides trading confirmation insights by helping traders identify stocks with breakout potential. When combined with other confirmation indicators, such as the Elegant Oscillator or momentum candles, traders can validate the breakout signals and reduce the risk of false moves. These trading confirmation signals ensure a higher probability of entering successful trades by adding layers of confirmation before acting.

Visit our website now to explore our services and plans, and sign up for a trial membership to start your journey towards successful trading!
Trading Indicators Enhance Decisions

Making informed trading decisions requires the application of trading confirmation insights. Combining these tools, whether the Momentum Candles, Elegant Oscillator, or Composite Index, guarantees more accuracy in trade setups.
The Composite Index, the Elegant Oscillator, the Dorsey Inertia, and the Linear Regression Slope are some of the indicators that can be used to find out about market momentum and trend confirmation. The Triangle Moving Average provides a reliable baseline.
As we’ve explored the top confirmation indicators, remember that no single tool guarantees success. Continuous learning, practice, and integration of these indicators into a comprehensive trading strategy are crucial for any trader aiming to achieve consistency and profitability in the markets.
Join Sniper Trades to stay up-to-date with real-time trading confirmation insights and become part of a vibrant community focused on providing trading confirmation signals that help you succeed in the market.