Setting up a trading screen isn’t just about throwing up a bunch of charts and hoping for the best. It’s about crafting a space that works for you, where every piece of information is right where you need it. Whether you’re a day trader glued to your screen or someone who checks in a few times a week, having the right setup can make or break your strategy. Let’s dive into what makes the perfect trading screen and how you can set one up to suit your unique style.
Creating An Efficient Trading Workspace
Understanding Your Trading Style
First off, knowing your trading style is like setting the foundation for your entire workspace. Are you a day trader, a swing trader, or maybe into long-term investing? Each style demands a different setup. Day traders, for instance, might require quick access to real-time data, while swing traders might focus on broader market trends. Understanding your trading style helps you tailor your workspace to suit your specific needs, ensuring that you’re not overwhelmed by unnecessary tools or information. This understanding is crucial because it directs the kind of tools and layout you’ll need, allowing you to create a space that complements your trading activities rather than complicating them.
Choosing The Right Tools
Once you grasp your trading style, it’s time to select the tools that will make your trading more efficient. This isn’t just about picking the latest software or the most complex indicators; it’s about choosing what truly aids your decision-making process. For instance, some traders might benefit from multiple monitors to keep track of different markets simultaneously, while others might find a single, well-organized screen more effective. The key is to find tools that enhance your workflow, helping you stay focused and informed.
Minimizing Visual Clutter
Visual clutter is a trader’s worst enemy. Too many charts, indicators, and data streams can lead to confusion and poor decision-making. It’s important to streamline your workspace, ensuring that only the most essential information is visible at any given time. This not only makes your trading environment more pleasant but also enhances your ability to process information quickly and accurately. A distraction-free workspace is essential for maintaining focus and improving your trading performance. By minimizing visual noise, you can better concentrate on the trades that matter, reducing the risk of errors and enhancing your overall efficiency.

Organizing Your Trading Screen
Separating Time Frames
When it comes to organizing your trading screen, separating time frames is a smart move. If you’re juggling multiple time frames, make sure each is positioned strategically. Keep your short-term charts, like the 1-minute or 5-minute, front and center. This way, you’re always ready for quick decisions. Longer time frames, like the daily or weekly, should sit off to the side. This setup lets you focus on immediate trades while still keeping an eye on the bigger picture. By clearly dividing your time frames, you avoid the chaos of mixed signals and can make more informed trading choices.
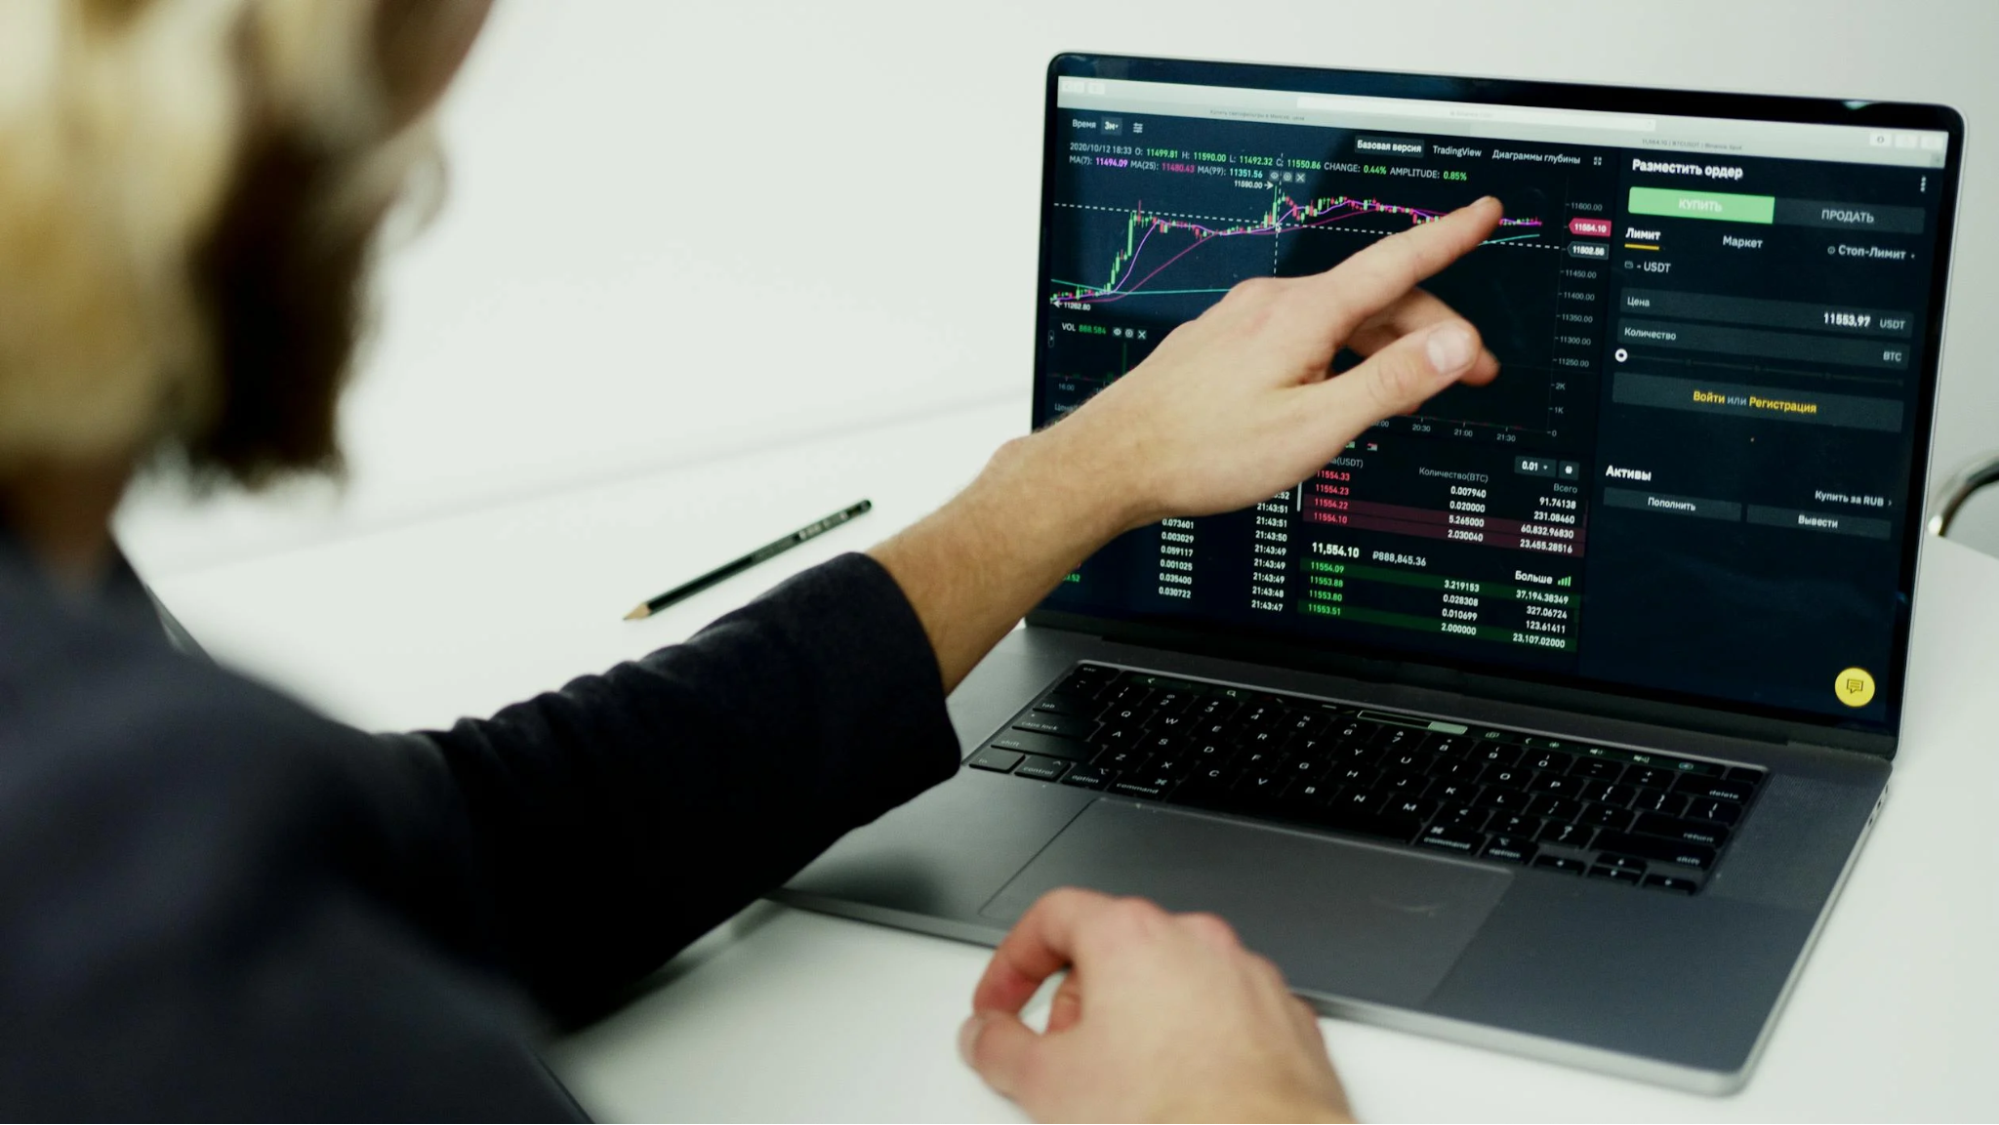
Positioning Key Information
Positioning key information is all about accessibility. Your primary trading tools and data should be right where you can see them at a glance. Place your order entry windows, real-time data feeds, and critical indicators in the center of your screen. This ensures you don’t miss a beat when the market shifts. It’s like having your own command center, where everything you need is within reach. By keeping essential information front and center, you minimize the risk of missing out on significant market moves.
Maintaining Simplicity
Maintaining simplicity is crucial for effective trading. It’s easy to get carried away with every chart, indicator, and news feed available, but too much information can be distracting. Focus on what truly matters for your strategy. Strip down your screen to the essentials, using only the indicators and charts that directly support your trading decisions. A cleaner screen helps reduce decision fatigue and keeps your mind clear, allowing you to react swiftly to market changes. Remember, simplicity isn’t about having less; it’s about having just what you need to succeed.
Utilizing Multiple Monitors Effectively
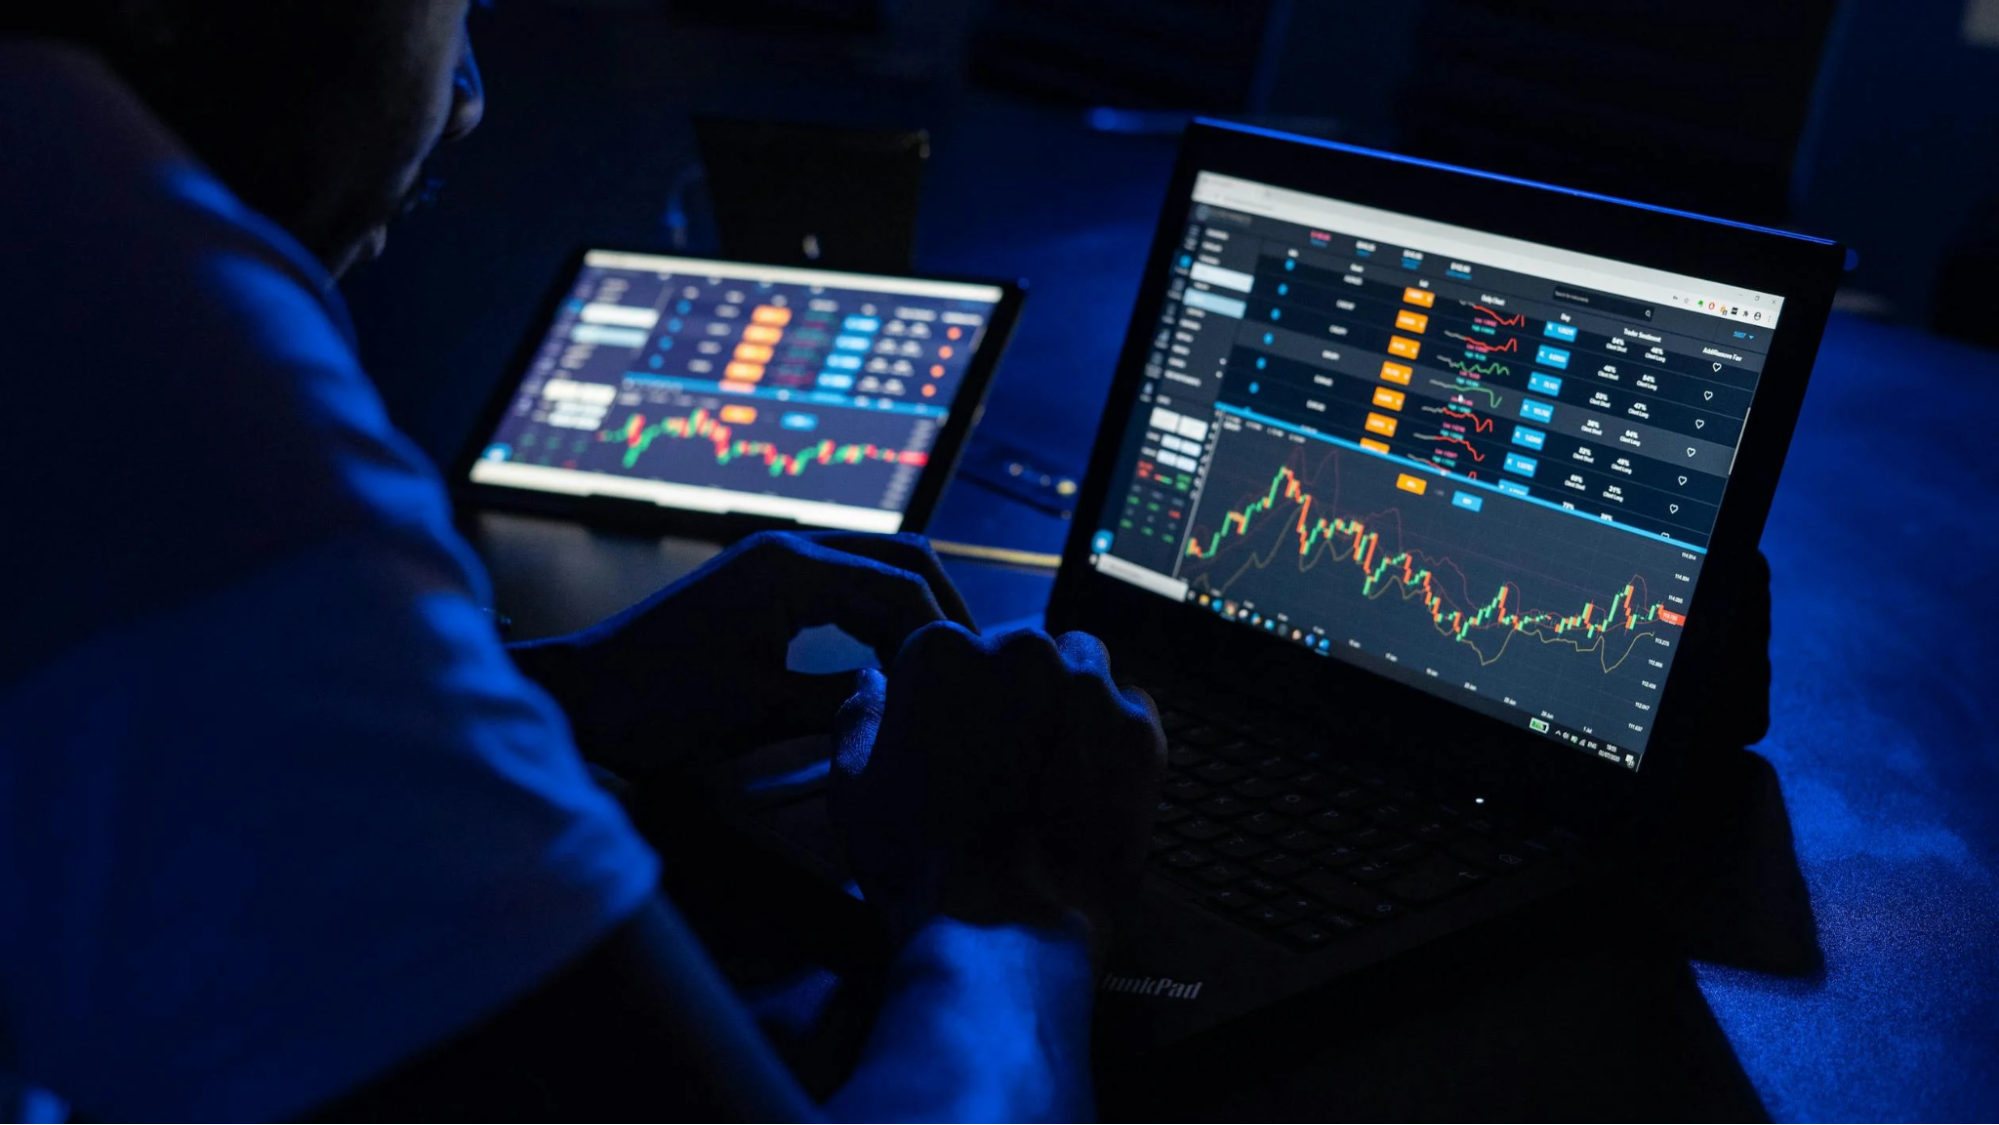
Benefits Of Multi-Monitor Setups
Having multiple monitors can really change how you experience trading. With extra screens, you get a broader view of the market, which is a game-changer for making quick decisions. When you’re juggling several trades and keeping an eye on different charts, the extra space means you won’t miss crucial data. More screen space means more information at your fingertips, helping you spot trends and react faster. It’s not just about having more monitors; it’s about setting them up in a way that makes your workflow smoother and more intuitive.
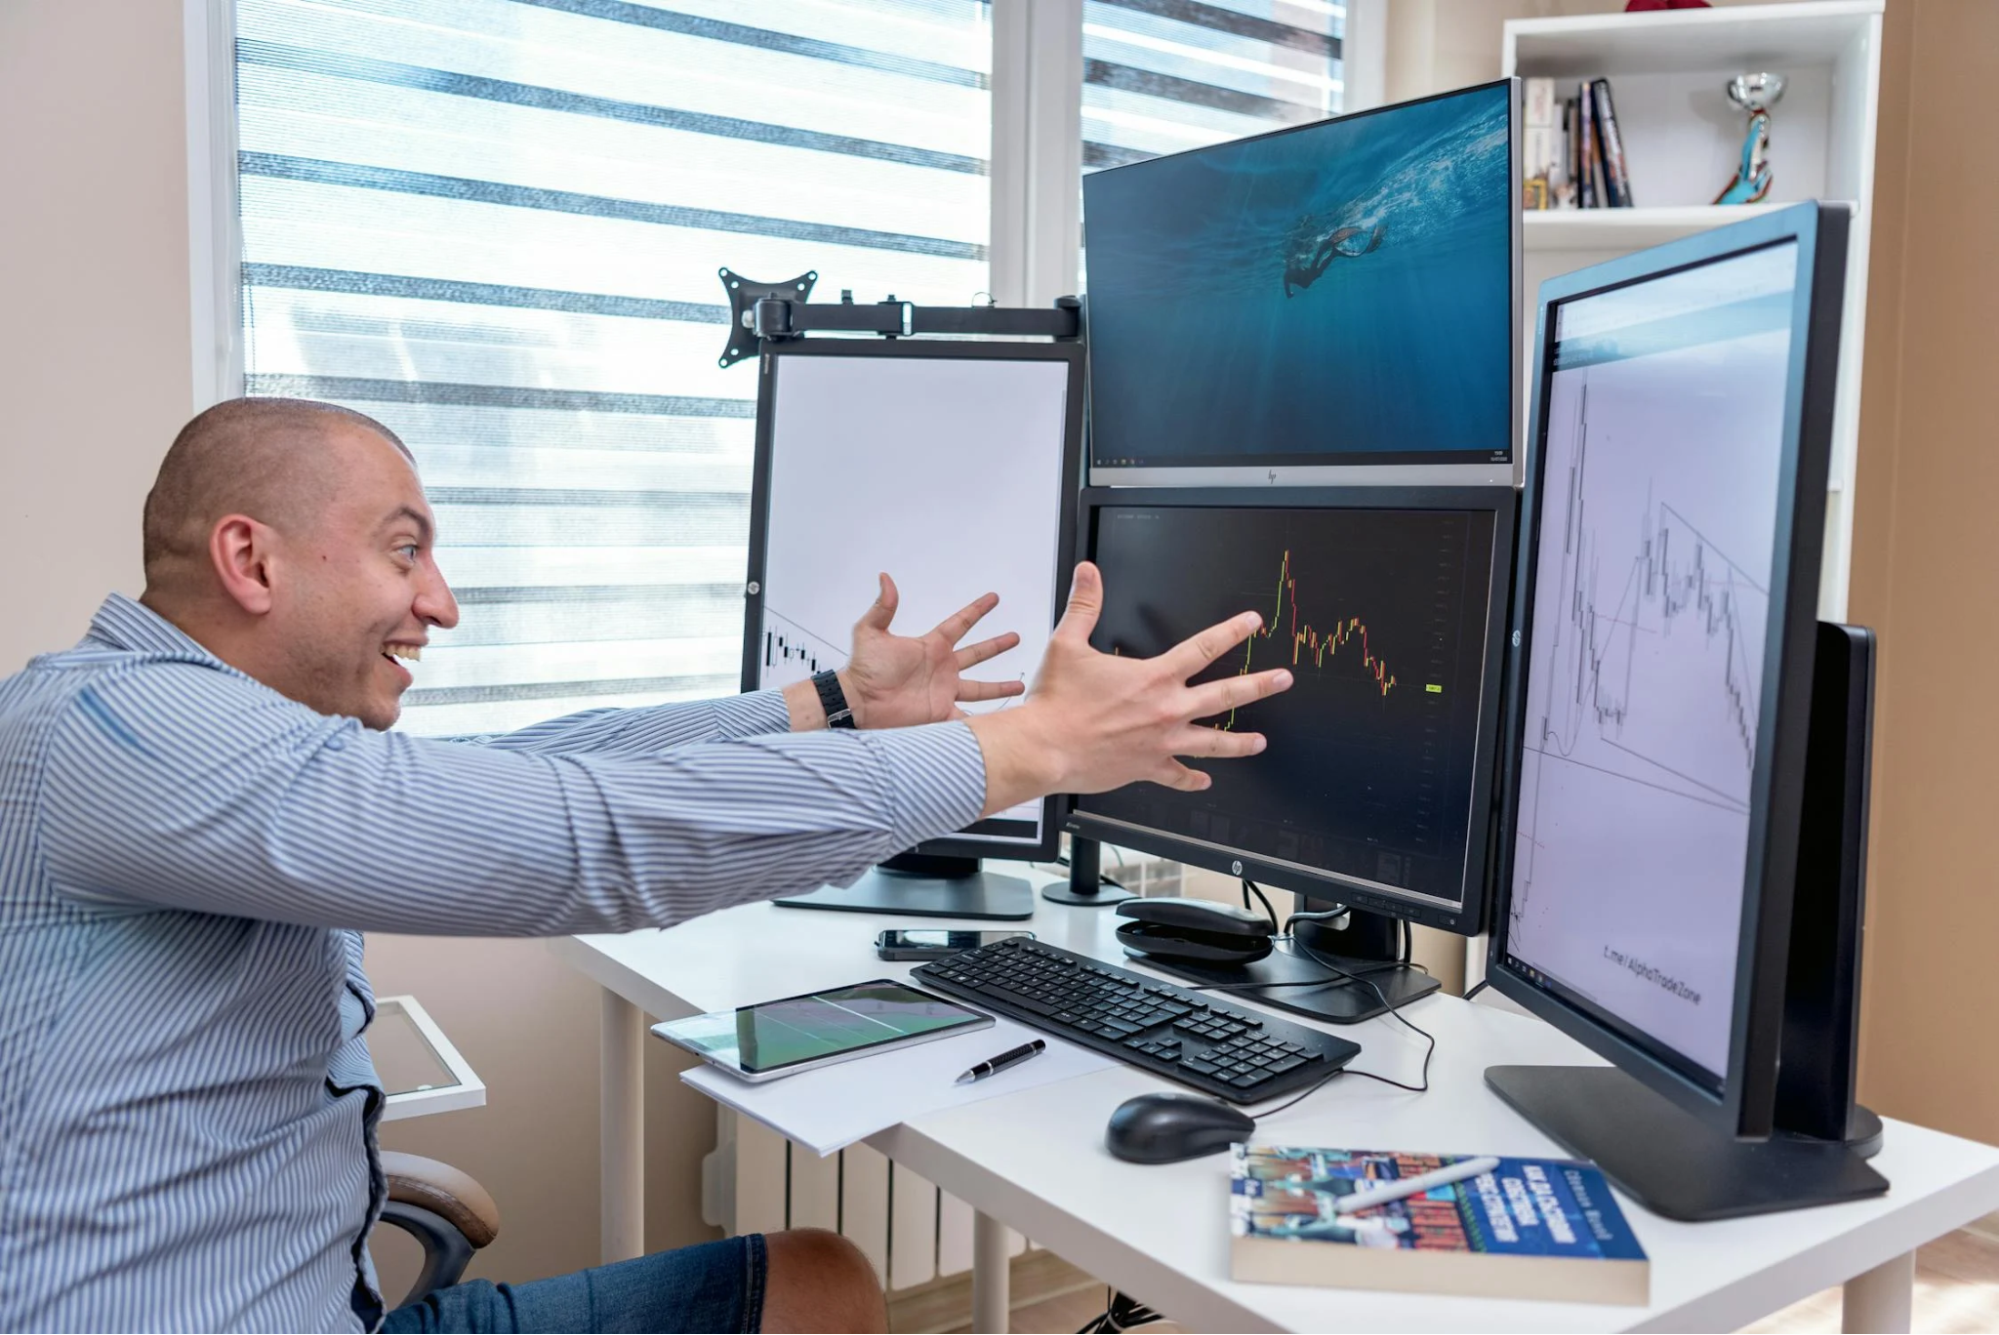
Optimal Monitor Arrangement
Arranging your monitors in the right way can drastically boost your trading efficiency. Ideally, you’d want your main trading screen to be front and center, with secondary screens angled slightly towards you for easy viewing. This setup minimizes neck strain and keeps all necessary information within your line of sight. Consider using a monitor arm if you’re dealing with multiple screens to keep your desk organized and your monitors at eye level. This way, you can easily switch focus between different data points without losing track of your trades.
Managing Screen Real Estate
Managing your screen real estate is all about knowing what to display where. Each monitor should serve a specific purpose, like one for charts, another for news feeds, and maybe a third for communication platforms. This division helps in reducing clutter and ensures that you have quick access to all the tools you need. It’s essential to keep your setup clean and straightforward, focusing on displaying only what you need to make informed decisions. Remember, trading is feasible with a single monitor, but multiple monitors can significantly enhance your trading experience by offering more space for various tools and information.
Incorporating Essential Indicators
Volume Price Analysis
When you’re trading, understanding the dynamics between volume and price is like having a secret weapon. Volume Price Analysis helps you see the strength behind a move. If a stock’s price is climbing but the volume isn’t keeping up, that might be a red flag. On the flip side, a price drop with high volume could signal a real shift in the market. It’s all about reading between the lines. By analyzing these patterns, you can spot potential breakouts or reversals. Technical indicators for options trading offer insights into such conditions, helping you decide when to enter or exit a trade.
Trend Line Analysis
Drawing trend lines might seem basic, but it’s a powerful tool in your trading toolkit. These lines help you visualize the market’s direction and potential turning points. When a stock hits a trend line, it often reacts—either bouncing back or breaking through. Watching how the volume behaves at these points can give you a clue about the market’s next move. For instance, if a trend line is broken with high volume, it might indicate a strong new trend. Indicators analyze price data to reveal such potential turning points, providing a clearer picture of market momentum.
Key Oscillators
Oscillators are like the mood rings of the trading world—they tell you if a market is “overbought” or “oversold.” Tools like the Relative Strength Index (RSI) or the Moving Average Convergence Divergence (MACD) can highlight when a stock might be due for a correction. These indicators are especially useful in sideways markets where price trends are less clear. After trying different oscillators, many traders find their favorites that promise consistent profits. Testing various trading indicators, including oscillators, can help you find what works best for your strategy.
Enhancing Trade Execution
Streamlining Order Entry
When it comes to trading, getting your orders in quickly and accurately is key. You need a setup where you can place orders without fumbling—speed matters, but so does precision. Having a streamlined order entry process can make a huge difference. This might mean customizing your trading platform to suit your needs or using hotkeys for those frequent trades. It’s all about reducing the time it takes to execute a trade and minimizing errors. Remember, in the fast-paced world of trading, a few seconds can mean the difference between profit and loss.
Real-Time Data Monitoring
Staying on top of real-time data is crucial. You want to keep an eye on the market’s pulse without getting overwhelmed. This means having the right data at your fingertips—price changes, volume spikes, and any news that might impact your trades. Consider setting up alerts for specific market conditions or price levels. This way, you’re not glued to the screen but still in the loop. TraderSync’s tools can help you evaluate and optimize strategies by offering real-time insights.
Adjusting To Market Conditions
Markets are unpredictable, and being adaptable is your best asset. This means being ready to tweak your strategy as things change. Maybe the market’s more volatile than usual, or perhaps it’s unusually calm. Either way, your approach should shift accordingly. Keep your strategy flexible, and don’t be afraid to make quick decisions. Mastering strategic trading involves knowing when to pivot and when to hold steady. It’s about balancing your instincts with the data at hand.
Customizing Your Chart Layout
Tailoring To Your Strategy
When you’re setting up your trading screen, it’s important to make sure it fits your personal trading style. Everyone’s got their own way of doing things, so your charts should reflect that. Start by identifying what you need to see at a glance. Are you a day trader or a swing trader? This will dictate the time frames you focus on. For instance, if you’re into swing trading, you’ll want to keep an eye on daily and weekly charts to spot those longer-term trends. Tailor your layout to highlight the information that matters most to you, and don’t clutter your screen with unnecessary data.
Using Templates For Efficiency
Once you’ve figured out what works for you, save it as a template. This way, you won’t have to start from scratch every time you log in. Templates can significantly reduce the time you spend setting up your charts each day. They ensure that your key indicators and time frames are always in place, ready for action. Think of it as setting up a workspace that’s ready to go whenever you are. This efficiency is particularly useful when markets are moving fast, and you need to make quick decisions.
Testing Different Configurations
Don’t be afraid to experiment with different chart setups. What works today might not be ideal tomorrow, especially as your trading style evolves. Try out various configurations to see what feels most natural and effective. Maybe you’ll find that a certain chart pattern gives you better insight into market trends, or perhaps a new indicator adds value to your analysis. Keep tweaking until you find a setup that gives you confidence in your trades. Remember, your chart layout is a tool—make sure it’s one that helps you succeed.

Analyzing Market Trends
Identifying Breakout Levels
When you’re trading, spotting breakout levels can be a game-changer. It’s about knowing when a stock is about to make a significant move, either up or down. Successful trading of breakouts requires identifying potential breakout patterns, such as trend lines and channels, particularly on higher time frames. Timing your entry just before a breakout is crucial, with a keen eye on volume as a confirmation factor. Without enough volume, a breakout might not have the momentum to sustain itself. It’s also important to manage your risk, setting pre-determined loss limits and diversifying your trades. Engaging with trading communities and using tools like charting software can help enhance your strategies and keep you informed about market trends. For more insights on this, check out trend line analysis.
Understanding Volume Patterns
Volume is like the heartbeat of the market. It tells you whether traders are interested in a stock or not. By analyzing volume patterns, you can gauge the strength of a trend and anticipate potential reversals. For instance, if a stock is rising but the volume is dropping, it might indicate a lack of interest and a possible reversal. On the other hand, a surge in volume during a breakout can confirm the move. This understanding is crucial for making informed trading decisions. Technical analysis can assist traders in understanding the disparity between intrinsic value and market price through various techniques, including volume analysis. Learn more about how technical analysis can guide your trading.
Evaluating Price Action
Price action is all about watching how prices move over time, without relying heavily on indicators. It’s a straightforward approach, focusing on identifying patterns and trends directly from price charts. By evaluating price action, you can spot potential entry and exit points. This method allows traders to react to market movements in real time, adapting their strategies as needed. Combining price action with volume analysis provides a fuller picture of market dynamics, helping you make well-rounded decisions. Understanding these aspects can significantly boost your trading success.
Understanding market trends is crucial for anyone looking to succeed in trading. By keeping an eye on how the market moves, you can make smarter decisions and improve your trading skills.
Create a Simple, Effective Trading Screen for Smarter Decisions
So, there you have it. Setting up the perfect trading screen isn’t just about throwing a bunch of charts and indicators together. It’s about finding what works for you, keeping it simple, and making sure you can see what you need when you need it. Remember, the goal is to make quick, informed decisions without getting lost in a sea of data. Start with the basics, tweak as you go, and soon enough, you’ll have a setup that feels just right. Happy trading!